
Digital Elevation Models (DEM) are crucial for terrain analysis, and contour lines are one of the best ways to visualize elevation changes. Instead of pre-generating contours and storing them as separate vector layers, GeoServer allows you to generate contours dynamically using SLD (Styled Layer Descriptor) styling and the gs:contour function via the WPS (Web Processing Service) plugin. This approach provides flexibility and reduces data storage requirements.
In this blog, we will walk through the process of generating contours dynamically in GeoServer using an SLD style with the gs:contour function.
Step 1: Prepare Your DEM Data
Before applying styling, ensure that your DEM data is available in a format supported by GeoServer, such as:
- GeoTIFF (.tif)
- NetCDF (.nc)
- GRIB (.grb)
If your DEM is in another format, you may need to convert it to GeoTIFF using tools like GDAL:
gdal_translate -of GTiff input.dem output.tif
Upload this raster file to your GeoServer’s data directory or configure it as a new raster store.
Step 2: Add the DEM Layer to GeoServer
- Log in to the GeoServer admin interface.
- Navigate to Data > Stores.
- Click Add new store and choose GeoTIFF.
- Provide a name, upload the DEM file, and click Save.
- Once the store is created, click “Publish” next to the layer name.
- Configure the Coordinate Reference System (CRS) and confirm the layer settings.
- Click Save.
Your DEM layer should now be available as a WMS layer.
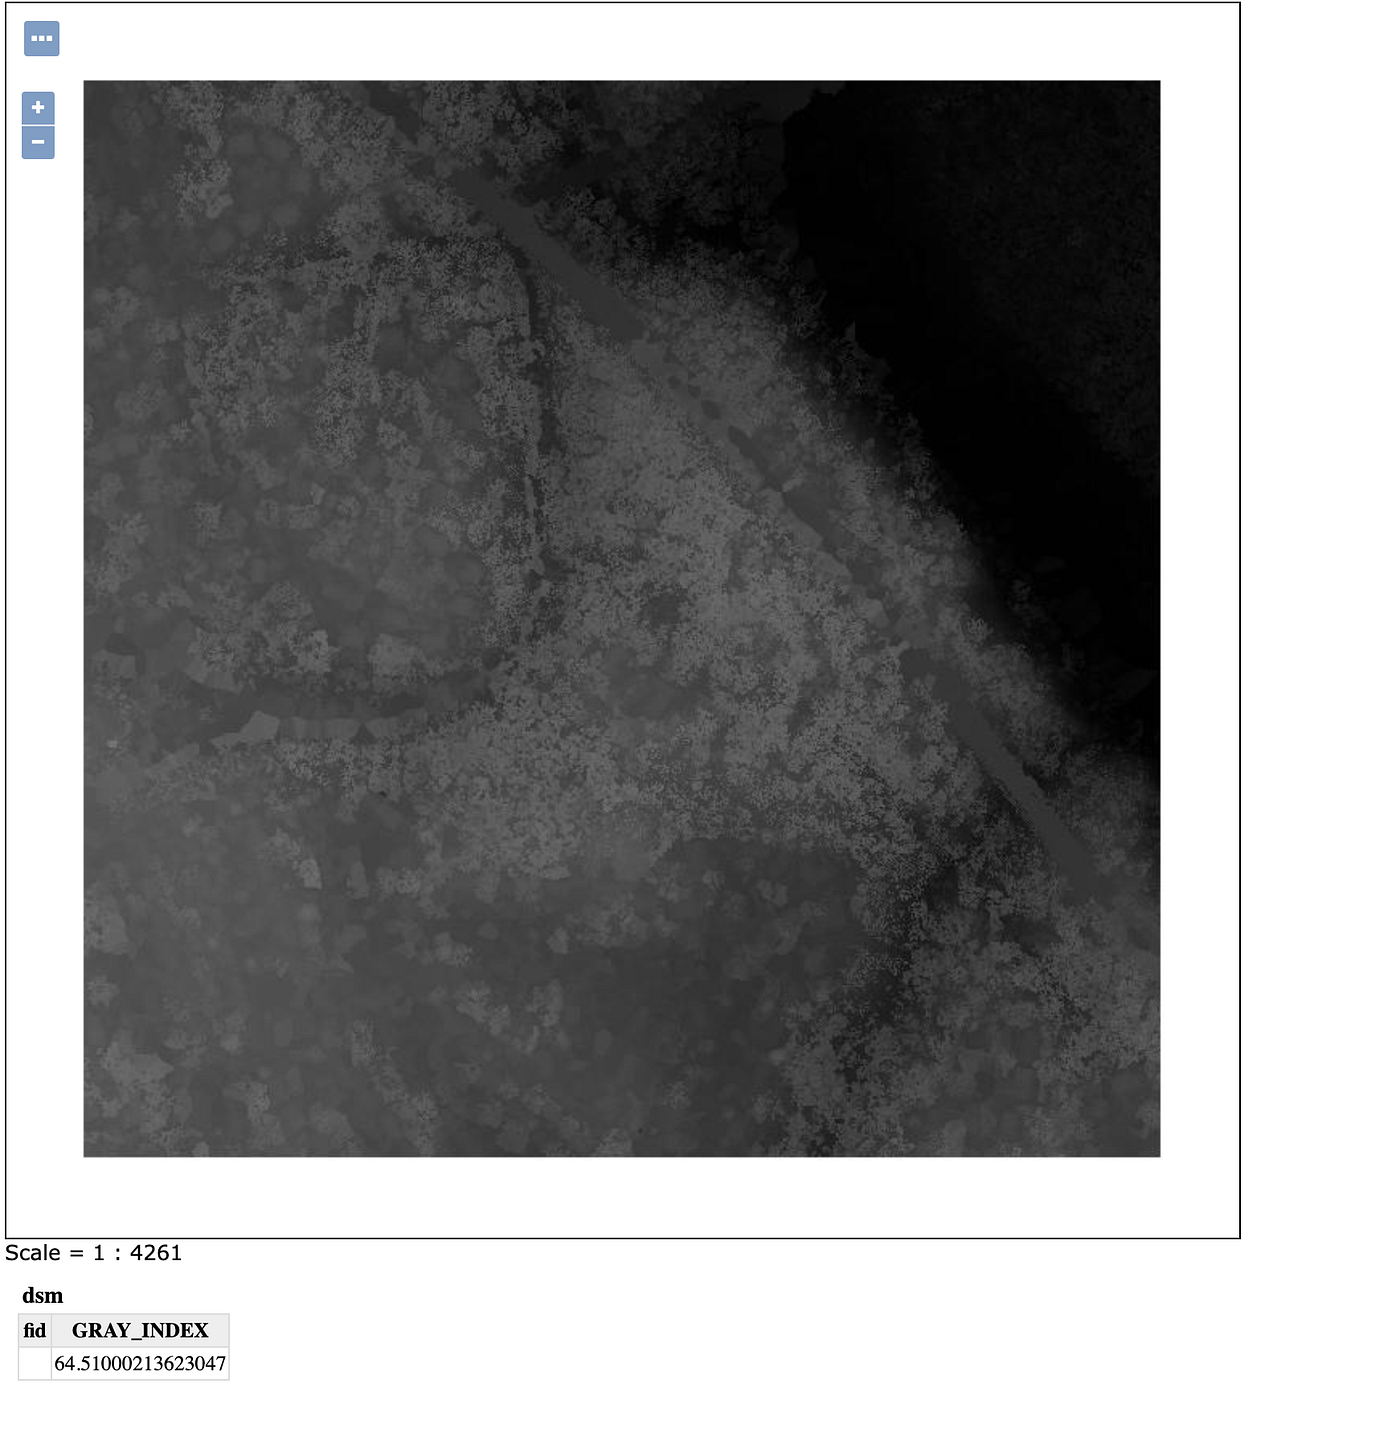
DEM data
Step 3: Enable WPS Plugin in GeoServer
The gs:contour function is part of the GeoServer WPS (Web Processing Service). To enable it:
- Download the plugin, if you haven’t
- Go to GeoServer Admin Panel.
- Navigate to Services > WPS.
- Ensure WPS is enabled.
- Save the settings.
Now, GeoServer can process on-the-fly contour generation using the gs:contour function.
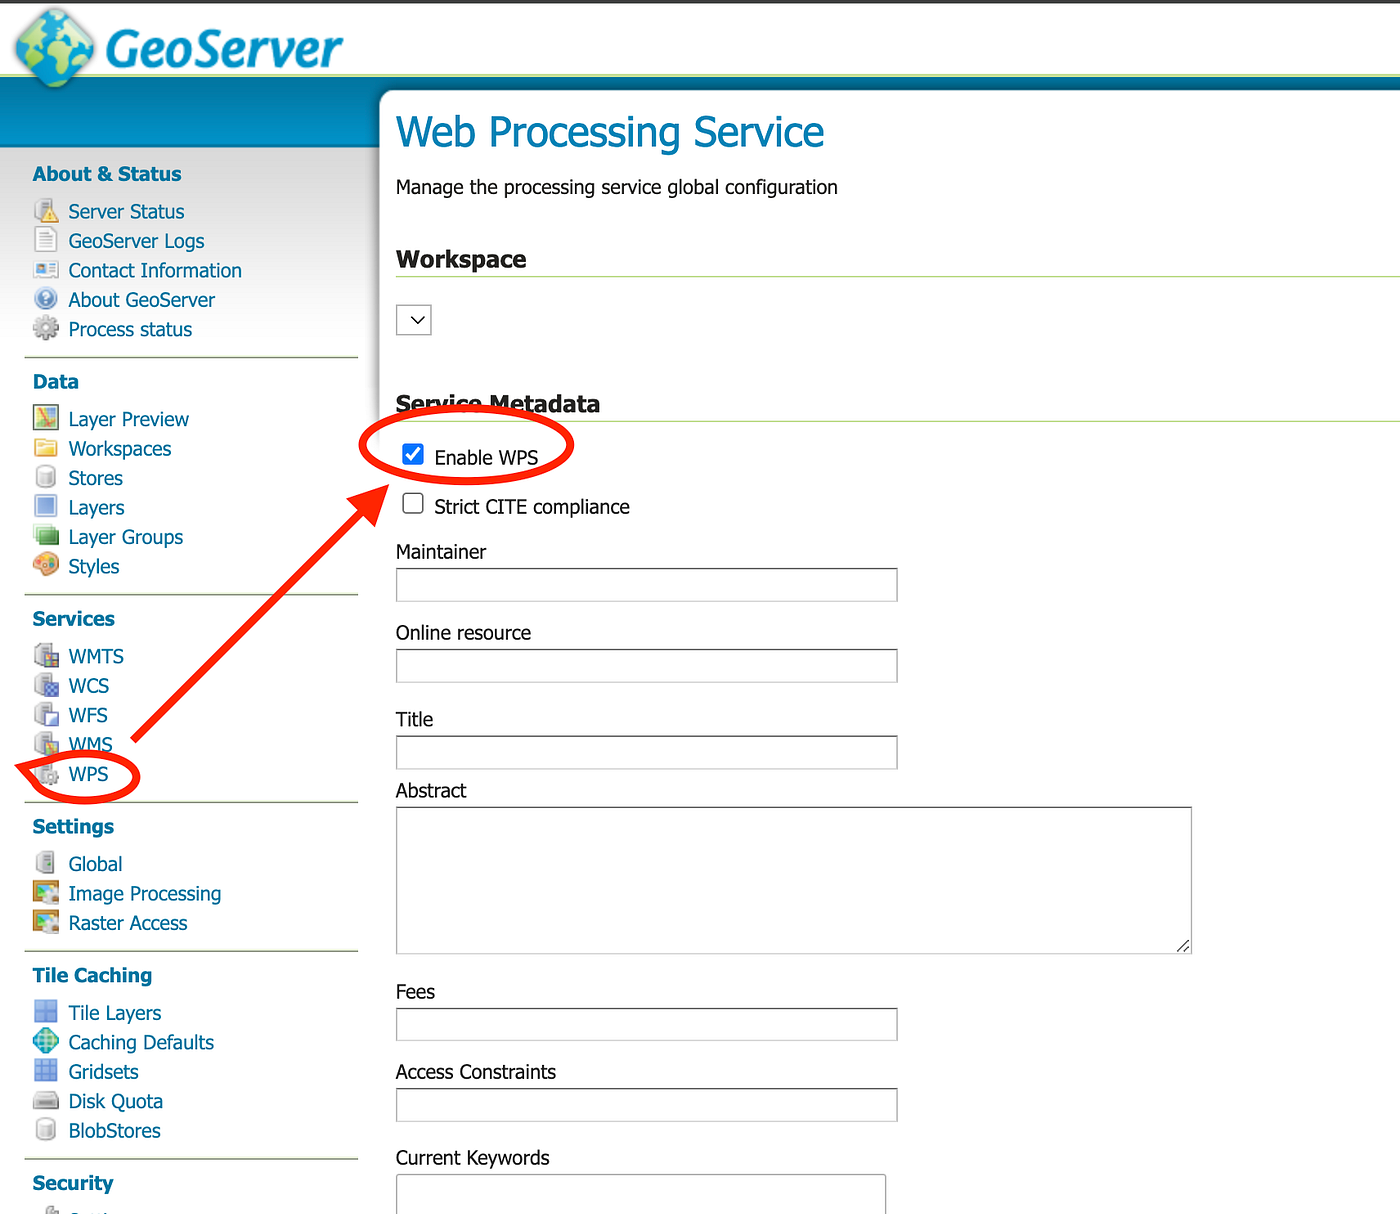
Enable WPS
Step 4: Create an SLD Style for Contours Using gs:contour
GeoServer’s SLD styling supports dynamic contour generation using gs:contour. We’ll plan to make blue lines representing contours and then we’ll add value of contours on each line, following the curve of line.
gs:contour will consider the value of DSM as data
We’ll initiate with defining SLD tag and name for style
<?xml version="1.0" encoding="ISO-8859-1"?>
<StyledLayerDescriptor version="1.0.0"
                     xsi:schemaLocation="http://www.opengis.net/sld StyledLayerDescriptor.xsd"
                     xmlns="http://www.opengis.net/sld"
                     xmlns:ogc="http://www.opengis.net/ogc"
                     xmlns:xlink="http://www.w3.org/1999/xlink"
                     xmlns:xsi="http://www.w3.org/2001/XMLSchema-instance">
<!-- a Named Layer is the basic building block of an SLD document -->
<NamedLayer>
  <Name>contour_line</Name>
  <UserStyle>
    <!-- Styles can have names, titles and abstracts -->
    <Title>Contour Line</Title>
    <!-- FeatureTypeStyles describe how to render different features -->
    <!-- A FeatureTypeStyle for rendering lines -->
    <FeatureTypeStyle>
now we define gs:contour Transformation tag, here we’ll define all the levels for which we want contour.
 <Transformation>
  <ogc:Function name="gs:Contour">
    <ogc:Function name="parameter">
      <ogc:Literal>data</ogc:Literal>
    </ogc:Function>
    <ogc:Function name="parameter">
      <ogc:Literal>levels</ogc:Literal>
      <ogc:Literal>50</ogc:Literal>
      <ogc:Literal>60</ogc:Literal>
      <ogc:Literal>70</ogc:Literal>

    </ogc:Function>
  </ogc:Function>
</Transformation>
After this we’ll define standard Rule for blue line and textlabel
<Rule>
    <Name>rule1</Name>
    <Title>Blue Contour Line</Title>
    <Abstract>A solid blue line with a 1 pixel width</Abstract>
    <LineSymbolizer>
      <Stroke>
        <CssParameter name="stroke">#0000FF</CssParameter>
      </Stroke>
    </LineSymbolizer>
    <TextSymbolizer>
      <Label>
        <ogc:PropertyName>value</ogc:PropertyName>
      </Label>
      <Font>
        <CssParameter name="font-family">Arial</CssParameter>
        <CssParameter name="font-style">Normal</CssParameter>
        <CssParameter name="font-size">10</CssParameter>
      </Font>
      <LabelPlacement>
        <LinePlacement>
        </LinePlacement>
      </LabelPlacement>
      <Halo>
        <Radius>
          <ogc:Literal>2</ogc:Literal>
        </Radius>
        <Fill>
          <CssParameter name="fill">#FFFFFF</CssParameter>
          <CssParameter name="fill-opacity">0.85</CssParameter>
        </Fill>
      </Halo>
      <Fill>
        <CssParameter name="fill">#000000</CssParameter>
      </Fill>
      <VendorOption name="followLine">true</VendorOption>
      <VendorOption name="repeat">200</VendorOption>
      <VendorOption name="maxDisplacement">50</VendorOption>
      <VendorOption name="maxAngleDelta">30</VendorOption>
    </TextSymbolizer>
  </Rule>
</FeatureTypeStyle>
</UserStyle>
</NamedLayer>
</StyledLayerDescriptor>
and done!
You can save it to see how does it looks on your DEM.
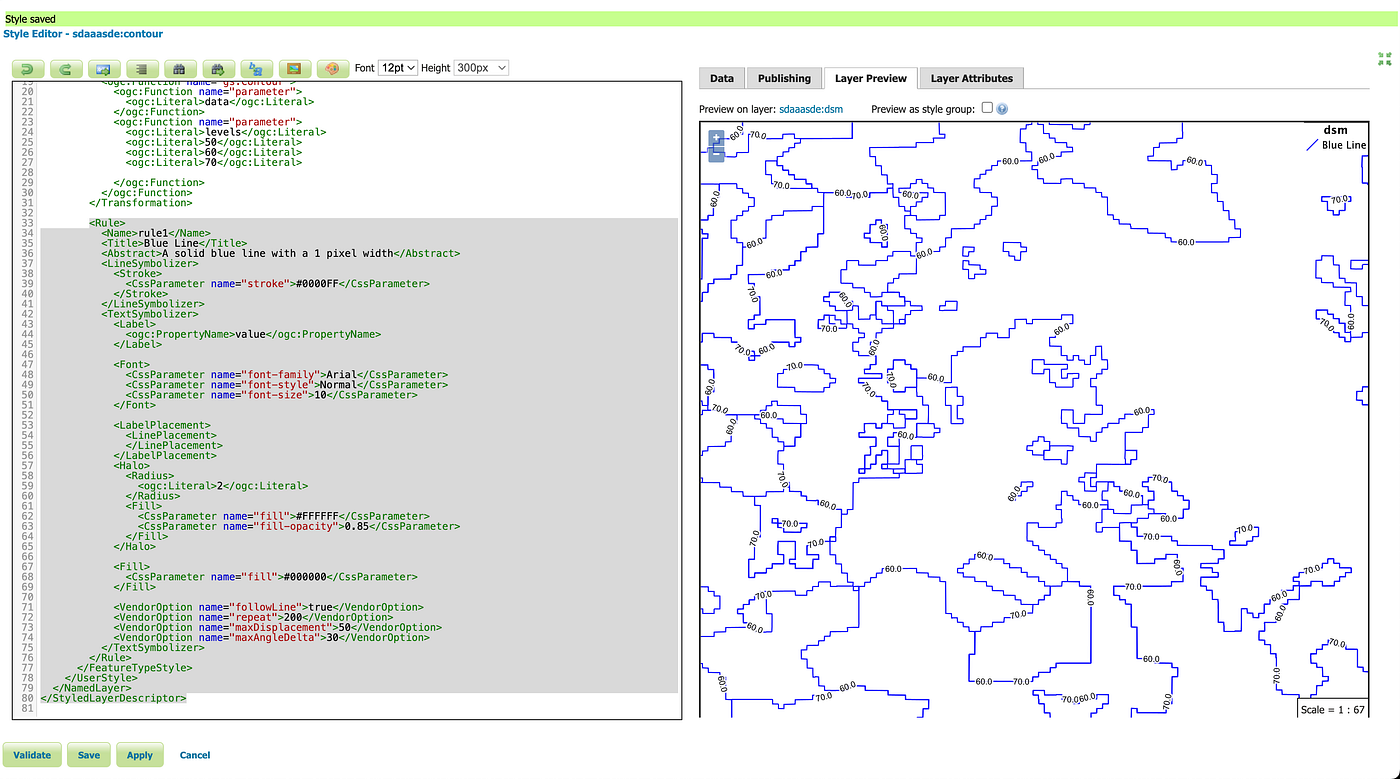
Contour style
Step 5: Serve Contours via WMS
To access the dynamically generated contours through WMS, you will need to pass your layer twice and style name of original dem as well as contour.
http://localhost:8080/geoserver/sdaaasde/wms?
service=WMS&version=1.1.0&request=GetMap
&layers=sdaaasde:dsm,sdaaasde:dsm
&bbox=389400.0%2C139400.0%2C390199.89999981376%2C140199.90000004656
&width=767&height=768&srs=EPSG%3A26985
&styles=,contour
&format=application/openlayers
As you can see in above example, I mentioned `sdaaasde:dsm` twice and then for styling, since I want default style for DSM, I kept it emtpy and then added contour for my second styling
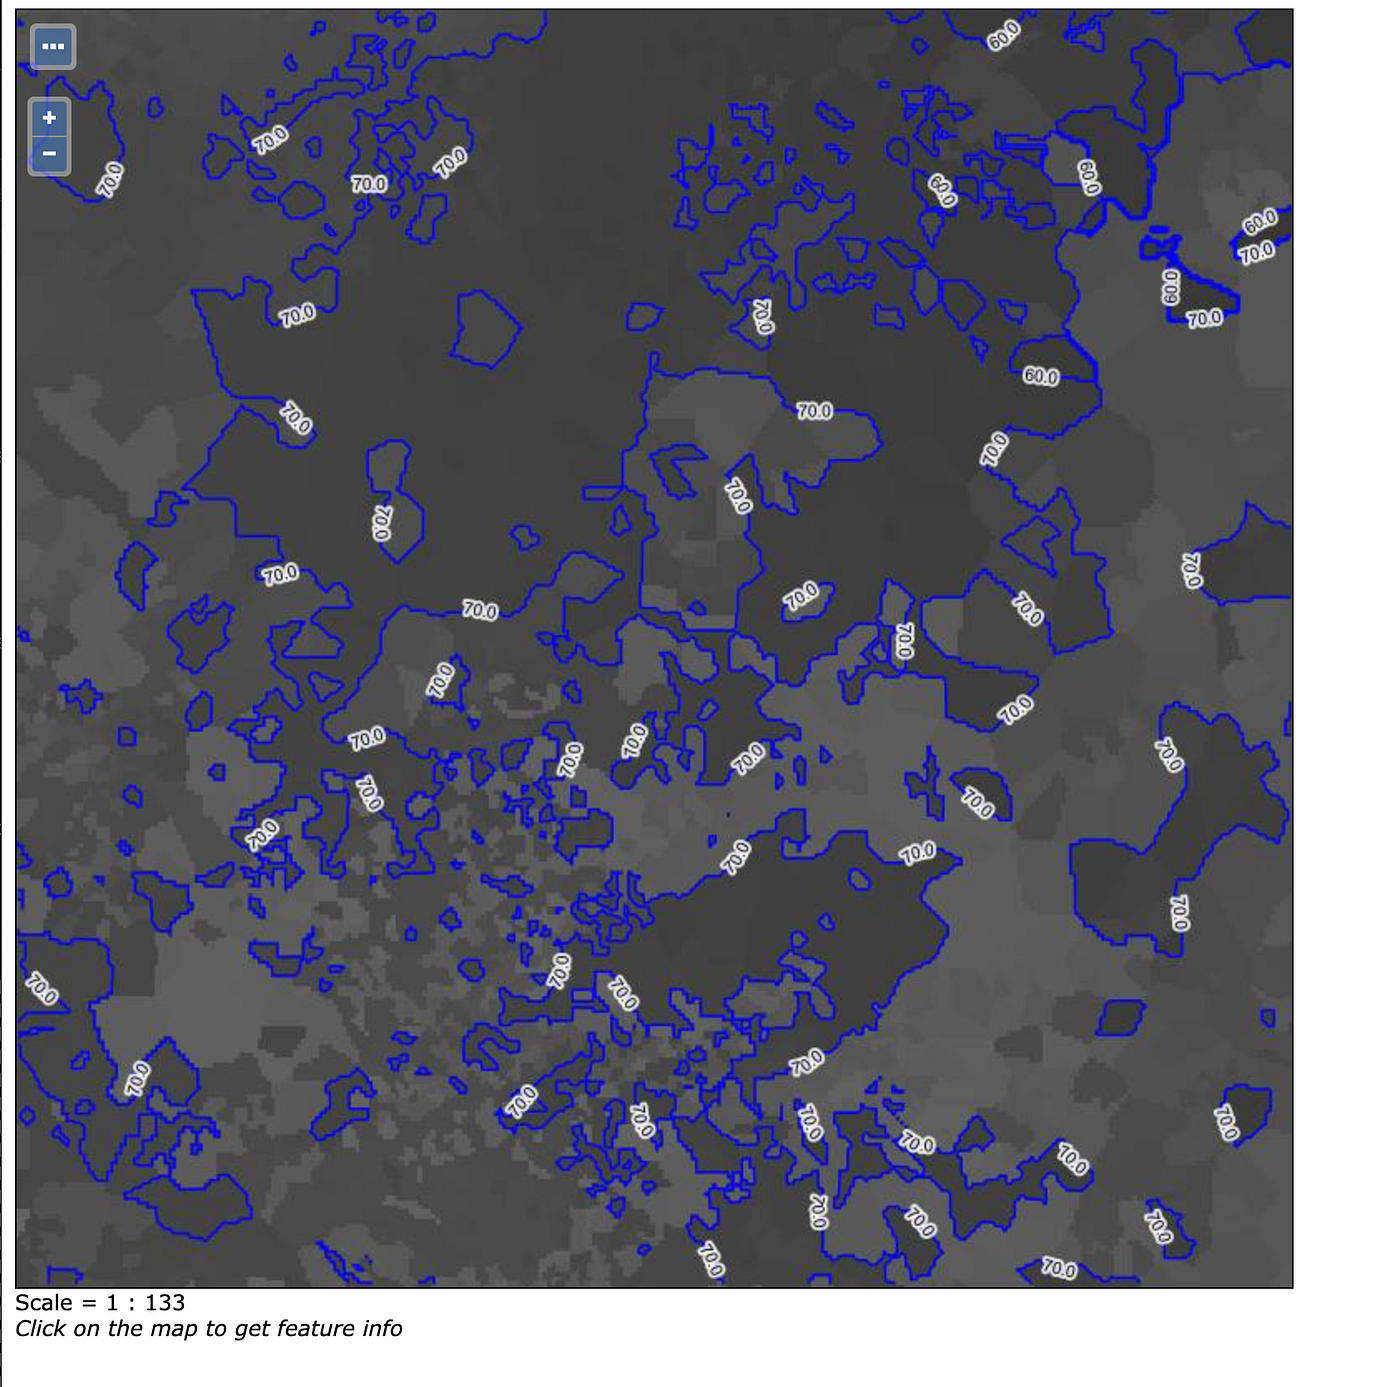
final result = DEM + Contour
Conclusion
Using GeoServer’s on-the-fly contour generation with gs:contour, you can efficiently visualize elevation changes without storing pre-generated contours. This method saves storage space and provides flexibility to adjust contour intervals dynamically.
By tweaking the SLD styling, you can enhance the contour appearance, making your DEM data more useful for analysis and visualization.